Quickstart
This walk-through uses the small demo dataset from the GeoAgent repository: a river network (rivers.shp) and an elevation model (DEM.tif) of the same area. Download both from paper/demo_dataset on GitHub. For the shapefile, download all the rivers.* files.
You need GeoAgent installed with a provider connected.
1. Load the data
Make sure General mode is selected in the Chat tab, and ask GeoAgent to add the layers (use your own paths):
Add C:/data/demo_dataset/shp/rivers.shp and C:/data/demo_dataset/tiff/DEM.tif
Then check what’s loaded:
Which layers are loaded?
2. Run a processing chain
Switch to Processing mode and describe the whole analysis in one message:
Buffer the rivers by 500 m, clip the DEM with the buffer and compute the slope of the clipped DEM
GeoAgent splits this into three tasks, picks an algorithm for each (native:buffer, gdal:cliprasterbymasklayer, native:slope), passes each result to the next task, and adds the results to your map:

The reply summarizes what was done:

3. See it as a model
Click Open in Model Designer under the reply. QGIS’s Model Designer shows the three steps, their parameters, and how the results flow from one to the next:
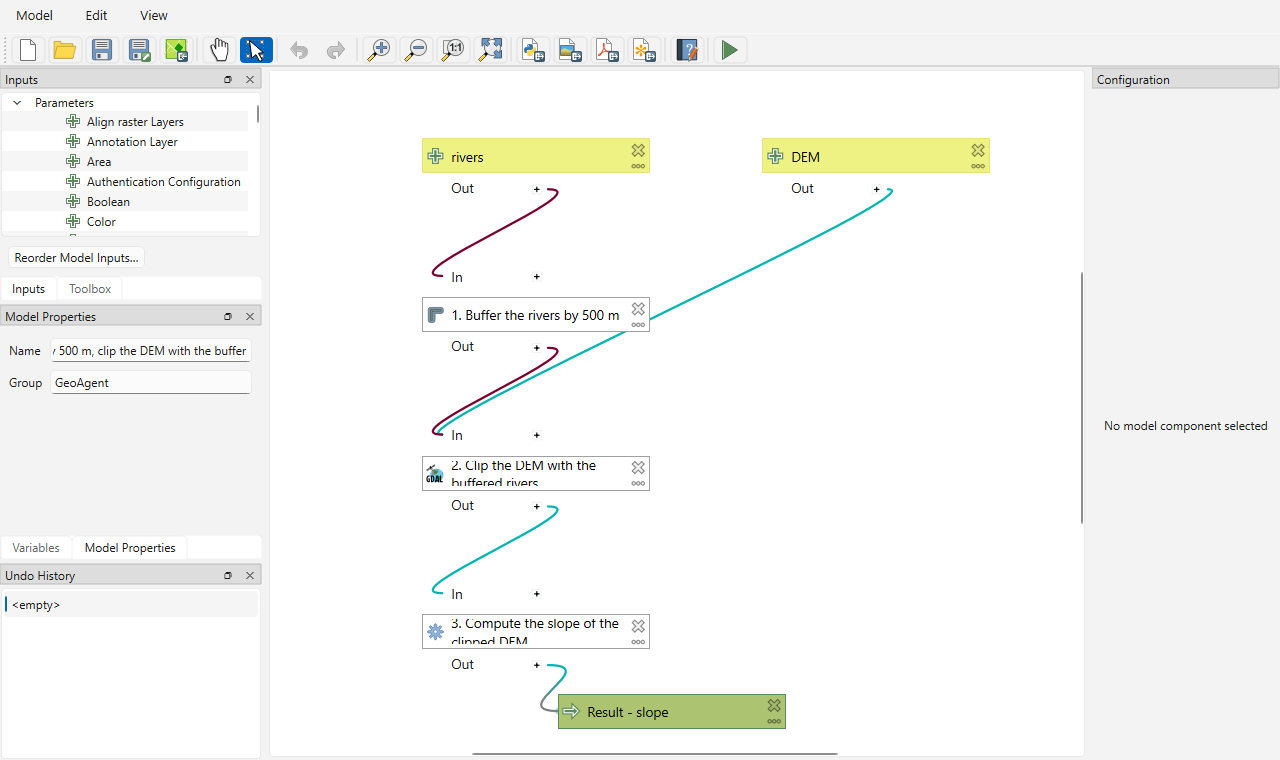
From here you can change parameters, run the model on other rivers or elevation data, or save it. Save as .model3 saves it directly. See Model export.
Next steps
Processing mode: how requests are interpreted, and how to word them.
Logs and token usage: follow each step, and see what each request cost.